Problem: Sketch the graph of the parametric curve given by
x(t) = t3 − 9t,
y(t) = (1/9)t4 − 2t2 + 9
for t real.
Solution: First we will try to find some basic features. Can we find intercepts?
The
![]()
There are two values of parameter for which the curve intersects the
The
![]()
There are three values of parameter for which the curve intersects the
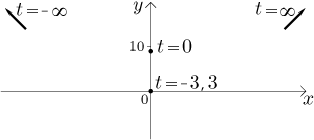
Another interesting question is what happens at the "ends". First we look at parameter near to minus infinity:

This means that if we send the parameter to minus infinity, the curve goes toward the "upper left end" of the plane. Now we look at the other "end" of the curve.

This means that if we send the parameter to infinity, the curve goes toward the "upper right end" of the plane. So far we know this:
Bonus fact: Note that
Now we will look at directions at which this curve goes for different values of the parameter. We know that the points where the direction changes are exactly the critical points of the functions x and y. There are two sources of critical points. We get critical points when derivative does not exists, but that does not happen for our two functions. Other critical points are those that make derivative zero.

There are five critical points that split the real line (as the place where
the parameter lives) into six sections. On each of those sections both
x and y are monotone as functions, that is, on each of them the
curve goes in one specific direction. We use a table and common sense to find
out what is happening (recall that ![]() positive means that the curve goes right and
positive means that the curve goes right and ![]() negative means that it goes
left, similarly
negative means that it goes
left, similarly ![]() determines direction up or down).
determines direction up or down).
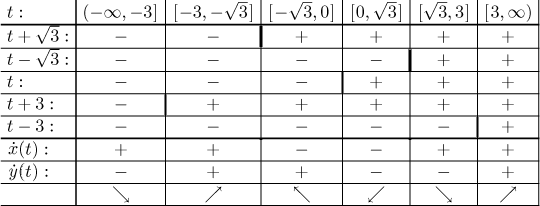
Before we sketch what we just found out, we identify the turning points in plane by substituting critical values of parameter to x and y. We will also put down the resulting points with 1 decimal place precision so that we can plot them.

Now we can draw a picture.
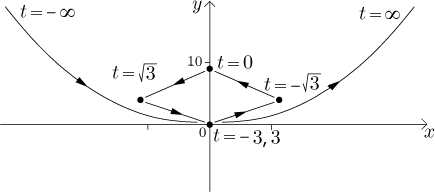
As we discussed in Theory, each
segment that we just identified can be considered a graph of some function
![]()
We will determine monotonicity of these functions (recall that each segment may be described by a different function).
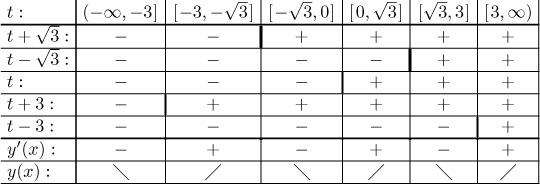
How do we interpret this? For instance, the values of parameter t
between 0 and root of 3 correspond to the segment going from
This point of view is useful, since it allows us to make the graph more
precise by considering concavity. We use the formula for the second spatial
derivative of
![]()
The only critical points are plus and minus root of 3. We have the following concavity.
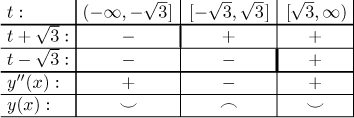
This seems to fit with the picture we have so far. Before we make the final sketch, we will calculate points for a few more values of parameter by substituting into x and y, we will round them to 1 decimal.

Now we draw the sketch.
