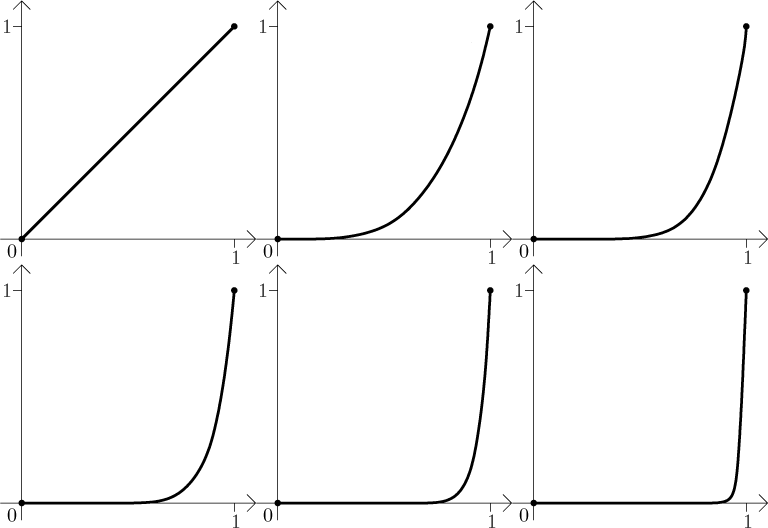
In the following picture we show the graphs of xk
on [0,1]. First we show graphs for k going from 1 to 10,
but they changes slower and slower for larger k and we would
have to wait to see how the graphs really get closer and closer to the
x-axis. Therefore we start skipping, after
x10 we show
x12, x15, x19,
x25, x33, and x45.


